Introduction to the Tidyverse
wrangling data with dplyr
Malcolm Barrett
June 18, 2019
1 / 112
2 / 112
3 / 112
Working with data in R
the tidyverse is a collection of friendly and consistent tools for data analysis and visualization.
4 / 112
Working with data in R
the tidyverse is a collection of friendly and consistent tools for data analysis and visualization.
They live as R packages each of which does one thing well.
5 / 112
library(tidyverse) will load
core tidyverse packages:
ggplot2, for data visualisation.
dplyr, for data manipulation.
tidyr, for data tidying.
readr, for data import.
purrr, for functional programming.
tibble, for tibbles, a modern re-imagining of data frames.
stringr, for strings.
forcats, for factors.
6 / 112
Game plan:
8:30-8:35: importing data: readr and haven
8:35-9:30: transforming data: dplyr
9:30-10:30: visualizing data: ggplot2
10:30-10:45: break
10:45-11:45: data viz exercise: ggplot2, dplyr, and friends
11:45-12:30: reproducible reports: R Markdown
7 / 112
Game plan:
importing data: readr/haven
transforming data: dplyr
visualizing data: ggplot2
data viz exercise
reproducible reports: R Markdown
8 / 112
readr
| Function | Reads |
|---|---|
read_csv() |
Comma separated values |
read_csv2() |
Semi-colon separate values |
read_delim() |
General delimited files |
read_fwf() |
Fixed width files |
read_log() |
Apache log files |
read_table() |
Space separated files |
read_tsv() |
Tab delimited values |
9 / 112
Importing Data
dataset <- read_csv("file_name.csv")dataset10 / 112
diabetes <- read_csv("../Data/diabetes.csv")diabetes## # A tibble: 403 x 19## id chol stab.glu hdl ratio glyhb location age## <dbl> <dbl> <dbl> <dbl> <dbl> <dbl> <chr> <dbl>## 1 1000 203 82 56 3.60 4.31 Bucking… 46## 2 1001 165 97 24 6.90 4.44 Bucking… 29## 3 1002 228 92 37 6.20 4.64 Bucking… 58## 4 1003 78 93 12 6.5 4.63 Bucking… 67## 5 1005 249 90 28 8.90 7.72 Bucking… 64## 6 1008 248 94 69 3.60 4.81 Bucking… 34## 7 1011 195 92 41 4.80 4.84 Bucking… 30## 8 1015 227 75 44 5.20 3.94 Bucking… 37## 9 1016 177 87 49 3.60 4.84 Bucking… 45## 10 1022 263 89 40 6.60 5.78 Bucking… 55## # … with 393 more rows, and 11 more variables:## # gender <chr>, height <dbl>, weight <dbl>, frame <chr>,## # bp.1s <dbl>, bp.1d <dbl>, …11 / 112
Tibbles
data.frames are the basic form of rectangular data in R (columns of variables, rows of observations)
12 / 112
Tibbles
data.frames are the basic form of rectangular data in R (columns of variables, rows of observations
read_csv() reads the data into a tibble, a modern version of the data frame.
13 / 112
Tibbles
data.frames are the basic form of rectangular data in R (columns of variables, rows of observations
read_csv() reads the data into a tibble, a modern version of the data frame.
a tibble is a data frame
14 / 112
haven
| Function | Software |
|---|---|
read_sas() |
SAS |
read_xpt() |
SAS |
read_spss() |
SPSS |
read_sav() |
SPSS |
read_por() |
SPSS |
read_stata() |
Stata |
read_dta() |
Stata |
haven is not a core member of the tidyverse. That means you need to load it with library(haven).
15 / 112
library(haven)diabetes <- read_sas("../Data/diabetes.sas7bdat")diabetes## # A tibble: 403 x 19## id chol stab_glu hdl ratio glyhb location age## <dbl> <dbl> <dbl> <dbl> <dbl> <dbl> <chr> <dbl>## 1 1000 203 82 56 3.60 4.31 Bucking… 46## 2 1001 165 97 24 6.90 4.44 Bucking… 29## 3 1002 228 92 37 6.20 4.64 Bucking… 58## 4 1003 78 93 12 6.5 4.63 Bucking… 67## 5 1005 249 90 28 8.90 7.72 Bucking… 64## 6 1008 248 94 69 3.60 4.81 Bucking… 34## 7 1011 195 92 41 4.80 4.84 Bucking… 30## 8 1015 227 75 44 5.20 3.94 Bucking… 37## 9 1016 177 87 49 3.60 4.84 Bucking… 45## 10 1022 263 89 40 6.60 5.78 Bucking… 55## # … with 393 more rows, and 11 more variables:## # gender <chr>, height <dbl>, weight <dbl>, frame <chr>,## # bp_1s <dbl>, bp_1d <dbl>, …16 / 112
Writing data
| Function | Writes |
|---|---|
write_csv() |
Comma separated values |
write_excel_csv() |
CSV that you plan to open in Excel |
write_delim() |
General delimited files |
write_file() |
A single string, written as is |
write_lines() |
A vector of strings, one string per line |
write_tsv() |
Tab delimited values |
write_rds() |
A data type used by R to save objects |
write_sas() |
SAS .sas7bdat files |
write_xpt() |
SAS transport format, .xpt |
write_sav() |
SPSS .sav files |
write_stata() |
Stata .dta files |
write_csv(diabetes, path = "diabetes-clean.csv")17 / 112
Game plan:
importing data: readr/haven
transforming data: dplyr
visualizing data: ggplot2
data viz exercise
reproducible reports: R Markdown
18 / 112
The main verbs of dplyr
select()
filter()
mutate()
arrange()
summarize()
group_by()
19 / 112
The main verbs of dplyr
select() = Subset columns (variables)
filter()
mutate()
arrange()
summarize()
group_by()
20 / 112
select()
select(<DATA>, <VARIABLES>)21 / 112
select()
select(<DATA>, <VARIABLES>)diamonds## # A tibble: 53,940 x 10## carat cut color clarity depth table price x y## <dbl> <ord> <ord> <ord> <dbl> <dbl> <int> <dbl> <dbl>## 1 0.23 Ideal E SI2 61.5 55 326 3.95 3.98## 2 0.21 Premium E SI1 59.8 61 326 3.89 3.84## 3 0.23 Good E VS1 56.9 65 327 4.05 4.07## 4 0.290 Premium I VS2 62.4 58 334 4.2 4.23## 5 0.31 Good J SI2 63.3 58 335 4.34 4.35## 6 0.24 Very G… J VVS2 62.8 57 336 3.94 3.96## 7 0.24 Very G… I VVS1 62.3 57 336 3.95 3.98## 8 0.26 Very G… H SI1 61.9 55 337 4.07 4.11## 9 0.22 Fair E VS2 65.1 61 337 3.87 3.78## 10 0.23 Very G… H VS1 59.4 61 338 4 4.05## # … with 53,930 more rows, and 1 more variable: z <dbl>22 / 112
select()
select(diamonds, carat, cut, color, clarity)23 / 112
select()
select(diamonds, carat, cut, color, clarity)## # A tibble: 53,940 x 4## carat cut color clarity## <dbl> <ord> <ord> <ord> ## 1 0.23 Ideal E SI2 ## 2 0.21 Premium E SI1 ## 3 0.23 Good E VS1 ## 4 0.290 Premium I VS2 ## 5 0.31 Good J SI2 ## 6 0.24 Very Good J VVS2 ## 7 0.24 Very Good I VVS1 ## 8 0.26 Very Good H SI1 ## 9 0.22 Fair E VS2 ## 10 0.23 Very Good H VS1 ## # … with 53,930 more rows24 / 112
select()
select(diamonds, carat, cut, color, clarity)select(diamonds, carat:clarity)select(diamonds, 1:4)select(diamonds, starts_with("c"))?select_helpers25 / 112
gapminder
library(gapminder)gapminder## # A tibble: 1,704 x 6## country continent year lifeExp pop gdpPercap## <fct> <fct> <int> <dbl> <int> <dbl>## 1 Afghanistan Asia 1952 28.8 8425333 779.## 2 Afghanistan Asia 1957 30.3 9240934 821.## 3 Afghanistan Asia 1962 32.0 10267083 853.## 4 Afghanistan Asia 1967 34.0 11537966 836.## 5 Afghanistan Asia 1972 36.1 13079460 740.## 6 Afghanistan Asia 1977 38.4 14880372 786.## 7 Afghanistan Asia 1982 39.9 12881816 978.## 8 Afghanistan Asia 1987 40.8 13867957 852.## 9 Afghanistan Asia 1992 41.7 16317921 649.## 10 Afghanistan Asia 1997 41.8 22227415 635.## # … with 1,694 more rows26 / 112
Your turn 1
Alter the code to select just the pop column:
select(gapminder, year, lifeExp)27 / 112
Your Turn 1
select(gapminder, pop)## # A tibble: 1,704 x 1## pop## <int>## 1 8425333## 2 9240934## 3 10267083## 4 11537966## 5 13079460## 6 14880372## 7 12881816## 8 13867957## 9 16317921## 10 22227415## # … with 1,694 more rows28 / 112
Quiz
Which of these is NOT a way to select the country and continent columns together?
select(gapminder, -c(year, lifeExp, pop, gdpPercap))select(gapminder, country:continent)select(gapminder, starts_with("c"))select(gapminder, ends_with("t"))29 / 112
Quiz
Which of these is NOT a way to select the country and continent columns together?
select(gapminder, ends_with("t"))## # A tibble: 1,704 x 1## continent## <fct> ## 1 Asia ## 2 Asia ## 3 Asia ## 4 Asia ## 5 Asia ## 6 Asia ## 7 Asia ## 8 Asia ## 9 Asia ## 10 Asia ## # … with 1,694 more rows30 / 112
The main verbs of dplyr
select()
filter() = Subset rows by value
mutate()
arrange()
summarize()
group_by()
31 / 112
filter()
filter(<DATA>, <PREDICATES>)32 / 112
filter()
filter(<DATA>, <PREDICATES>)Predicates: TRUE/FALSE statements
32 / 112
filter()
filter(<DATA>, <PREDICATES>)Predicates: TRUE/FALSE statements
TRUE/FALSE statementsComparisons: >, >=, <, <=, != (not equal), and == (equal).
33 / 112
filter()
filter(<DATA>, <PREDICATES>)Predicates: TRUE/FALSE statements
TRUE/FALSE statementsComparisons: >, >=, <, <=, != (not equal), and == (equal).
>, >=, <, <=, != (not equal), and == (equal).Operators: & is "and", | is "or", and ! is "not"
34 / 112
filter()
filter(<DATA>, <PREDICATES>)Predicates: TRUE/FALSE statements
TRUE/FALSE statementsComparisons: >, >=, <, <=, != (not equal), and == (equal).
>, >=, <, <=, != (not equal), and == (equal).Operators: & is "and", | is "or", and ! is "not"
& is "and", | is "or", and ! is "not"%in%
35 / 112
filter()
filter(<DATA>, <PREDICATES>)Predicates: TRUE/FALSE statements
TRUE/FALSE statementsComparisons: >, >=, <, <=, != (not equal), and == (equal).
>, >=, <, <=, != (not equal), and == (equal).Operators: & is "and", | is "or", and ! is "not"
& is "and", | is "or", and ! is "not"%in%
"a" %in% c("a", "b", "c")## [1] TRUE35 / 112
filter()
filter(diamonds, cut == "Ideal", carat > 3)36 / 112
filter()
filter(diamonds, cut == "Ideal", carat > 3)## # A tibble: 4 x 10## carat cut color clarity depth table price x y## <dbl> <ord> <ord> <ord> <dbl> <dbl> <int> <dbl> <dbl>## 1 3.22 Ideal I I1 62.6 55 12545 9.49 9.42## 2 3.5 Ideal H I1 62.8 57 12587 9.65 9.59## 3 3.01 Ideal J SI2 61.7 58 16037 9.25 9.2 ## 4 3.01 Ideal J I1 65.4 60 16538 8.99 8.93## # … with 1 more variable: z <dbl>37 / 112
Your turn 2
Show:
All of the rows where pop is greater than or equal to 100000
All of the rows for El Salvador
All of the rows that have a missing value for year (no need to edit this code)
38 / 112
Your turn 2
Show:
All of the rows where pop is greater than or equal to 100000
All of the rows for El Salvador
All of the rows that have a missing value for year (no need to edit this code)
filter(gapminder, pop >= 100000)filter(gapminder, country == "El Salvador")filter(gapminder, is.na(year))39 / 112
filter()
filter(diamonds, cut == "Ideal" | cut == "Very Good", carat > 3)## # A tibble: 6 x 10## carat cut color clarity depth table price x y## <dbl> <ord> <ord> <ord> <dbl> <dbl> <int> <dbl> <dbl>## 1 3.22 Ideal I I1 62.6 55 12545 9.49 9.42## 2 3.5 Ideal H I1 62.8 57 12587 9.65 9.59## 3 3.04 Very Go… I SI2 63.2 59 15354 9.14 9.07## 4 4 Very Go… I I1 63.3 58 15984 10.0 9.94## 5 3.01 Ideal J SI2 61.7 58 16037 9.25 9.2 ## 6 3.01 Ideal J I1 65.4 60 16538 8.99 8.93## # … with 1 more variable: z <dbl>40 / 112
Your turn 3
Use Boolean operators to alter the code below to return only the rows that contain:
El Salvador
Countries that had populations over 100000 in 1960 or earlier
filter(gapminder, country == "El Salvador" | country == "Oman")filter(______, _______)41 / 112
Your turn 3
Use Boolean operators to alter the code below to return only the rows that contain:
El Salvador
Countries that had populations over 100000 in 1960 or earlier
filter(gapminder, country == "El Salvador")filter(gapminder, pop > 100000, year <= 1960)42 / 112
The main verbs of dplyr
select()
filter()
mutate() = Change or add a variable
arrange()
summarize()
group_by()
43 / 112
mutate()
mutate(<DATA>, <NAME> = <FUNCTION>)44 / 112
mutate()
mutate(diamonds, log_price = log(price), log_pricesq = log_price^2)45 / 112
mutate()
mutate(diamonds, log_price = log(price), log_pricesq = log_price^2)## # A tibble: 53,940 x 12## carat cut color clarity depth table price x y## <dbl> <ord> <ord> <ord> <dbl> <dbl> <int> <dbl> <dbl>## 1 0.23 Ideal E SI2 61.5 55 326 3.95 3.98## 2 0.21 Premium E SI1 59.8 61 326 3.89 3.84## 3 0.23 Good E VS1 56.9 65 327 4.05 4.07## 4 0.290 Premium I VS2 62.4 58 334 4.2 4.23## 5 0.31 Good J SI2 63.3 58 335 4.34 4.35## 6 0.24 Very G… J VVS2 62.8 57 336 3.94 3.96## 7 0.24 Very G… I VVS1 62.3 57 336 3.95 3.98## 8 0.26 Very G… H SI1 61.9 55 337 4.07 4.11## 9 0.22 Fair E VS2 65.1 61 337 3.87 3.78## 10 0.23 Very G… H VS1 59.4 61 338 4 4.05## # … with 53,930 more rows, and 3 more variables: z <dbl>,## # log_price <dbl>, log_pricesq <dbl>46 / 112
The main verbs of dplyr
select()
filter()
mutate()
arrange() = Sort the data set
summarize()
group_by()
47 / 112
arrange()
arrange(<DATA>, <SORTING VARIABLE>)48 / 112
arrange()
arrange(diamonds, price)## # A tibble: 53,940 x 10## carat cut color clarity depth table price x y## <dbl> <ord> <ord> <ord> <dbl> <dbl> <int> <dbl> <dbl>## 1 0.23 Ideal E SI2 61.5 55 326 3.95 3.98## 2 0.21 Premium E SI1 59.8 61 326 3.89 3.84## 3 0.23 Good E VS1 56.9 65 327 4.05 4.07## 4 0.290 Premium I VS2 62.4 58 334 4.2 4.23## 5 0.31 Good J SI2 63.3 58 335 4.34 4.35## 6 0.24 Very G… J VVS2 62.8 57 336 3.94 3.96## 7 0.24 Very G… I VVS1 62.3 57 336 3.95 3.98## 8 0.26 Very G… H SI1 61.9 55 337 4.07 4.11## 9 0.22 Fair E VS2 65.1 61 337 3.87 3.78## 10 0.23 Very G… H VS1 59.4 61 338 4 4.05## # … with 53,930 more rows, and 1 more variable: z <dbl>49 / 112
arrange()
arrange(diamonds, cut, price)## # A tibble: 53,940 x 10## carat cut color clarity depth table price x y## <dbl> <ord> <ord> <ord> <dbl> <dbl> <int> <dbl> <dbl>## 1 0.22 Fair E VS2 65.1 61 337 3.87 3.78## 2 0.25 Fair E VS1 55.2 64 361 4.21 4.23## 3 0.23 Fair G VVS2 61.4 66 369 3.87 3.91## 4 0.27 Fair E VS1 66.4 58 371 3.99 4.02## 5 0.3 Fair J VS2 64.8 58 416 4.24 4.16## 6 0.3 Fair F SI1 63.1 58 496 4.3 4.22## 7 0.34 Fair J SI1 64.5 57 497 4.38 4.36## 8 0.37 Fair F SI1 65.3 56 527 4.53 4.47## 9 0.3 Fair D SI2 64.6 54 536 4.29 4.25## 10 0.25 Fair D VS1 61.2 55 563 4.09 4.11## # … with 53,930 more rows, and 1 more variable: z <dbl>50 / 112
desc()
arrange(diamonds, cut, desc(price))## # A tibble: 53,940 x 10## carat cut color clarity depth table price x y## <dbl> <ord> <ord> <ord> <dbl> <dbl> <int> <dbl> <dbl>## 1 2.01 Fair G SI1 70.6 64 18574 7.43 6.64## 2 2.02 Fair H VS2 64.5 57 18565 8 7.95## 3 4.5 Fair J I1 65.8 58 18531 10.2 10.2 ## 4 2 Fair G VS2 67.6 58 18515 7.65 7.61## 5 2.51 Fair H SI2 64.7 57 18308 8.44 8.5 ## 6 3.01 Fair I SI2 65.8 56 18242 8.99 8.94## 7 3.01 Fair I SI2 65.8 56 18242 8.99 8.94## 8 2.32 Fair H SI1 62 62 18026 8.47 8.31## 9 5.01 Fair J I1 65.5 59 18018 10.7 10.5 ## 10 1.93 Fair F VS1 58.9 62 17995 8.17 7.97## # … with 53,930 more rows, and 1 more variable: z <dbl>51 / 112
Your turn 4
Arrange gapminder by year. Add lifeExp as a second (tie breaking) variable to arrange on.
Which country had the lowest life expectancy in 1952?
52 / 112
Your turn 4
arrange(gapminder, year, lifeExp)## # A tibble: 1,704 x 6## country continent year lifeExp pop gdpPercap## <fct> <fct> <int> <dbl> <int> <dbl>## 1 Afghanistan Asia 1952 28.8 8425333 779.## 2 Gambia Africa 1952 30 284320 485.## 3 Angola Africa 1952 30.0 4232095 3521.## 4 Sierra Leone Africa 1952 30.3 2143249 880.## 5 Mozambique Africa 1952 31.3 6446316 469.## 6 Burkina Faso Africa 1952 32.0 4469979 543.## 7 Guinea-Bissau Africa 1952 32.5 580653 300.## 8 Yemen, Rep. Asia 1952 32.5 4963829 782.## 9 Somalia Africa 1952 33.0 2526994 1136.## 10 Guinea Africa 1952 33.6 2664249 510.## # … with 1,694 more rows53 / 112
Your turn 5
Use desc() to find the country with the highest gdpPercap.
54 / 112
Your turn 5
arrange(gapminder, desc(gdpPercap))## # A tibble: 1,704 x 6## country continent year lifeExp pop gdpPercap## <fct> <fct> <int> <dbl> <int> <dbl>## 1 Kuwait Asia 1957 58.0 212846 113523.## 2 Kuwait Asia 1972 67.7 841934 109348.## 3 Kuwait Asia 1952 55.6 160000 108382.## 4 Kuwait Asia 1962 60.5 358266 95458.## 5 Kuwait Asia 1967 64.6 575003 80895.## 6 Kuwait Asia 1977 69.3 1140357 59265.## 7 Norway Europe 2007 80.2 4627926 49357.## 8 Kuwait Asia 2007 77.6 2505559 47307.## 9 Singapore Asia 2007 80.0 4553009 47143.## 10 Norway Europe 2002 79.0 4535591 44684.## # … with 1,694 more rows55 / 112
Detour: The Pipe
%>%
Passes the result on one function to another function
56 / 112
Detour: The Pipe
diamonds <- arrange(diamonds, price)diamonds <- filter(diamonds, price > 300)diamonds <- mutate(diamonds, log_price = log(price))diamonds57 / 112
Detour: The Pipe
diamonds <- diamonds %>% arrange(price) %>% filter(price > 300) %>% mutate(log_price = log(price))diamonds58 / 112
Detour: The Pipe
diamonds <- diamonds %>% arrange(price) %>% filter(price > 300) %>% mutate(log_price = log(price))diamondsInsert with ctrl/cmd + shift + m
58 / 112
Your turn 6
Use %>% to write a sequence of functions that:
1. Filter only countries that are in the continent of Oceania.
2. Select the country, year and lifeExp columns
3. Arrange the results so that the highest life expetency is at the top.
59 / 112
Your turn 6
gapminder %>% filter(continent == "Oceania") %>% select(country, year, lifeExp) %>% arrange(desc(lifeExp))## # A tibble: 24 x 3## country year lifeExp## <fct> <int> <dbl>## 1 Australia 2007 81.2## 2 Australia 2002 80.4## 3 New Zealand 2007 80.2## 4 New Zealand 2002 79.1## 5 Australia 1997 78.8## 6 Australia 1992 77.6## 7 New Zealand 1997 77.6## 8 New Zealand 1992 76.3## 9 Australia 1987 76.3## 10 Australia 1982 74.7## # … with 14 more rows60 / 112
The main verbs of dplyr
select()
filter()
mutate()
arrange()
summarize() = Summarize the data
group_by() = Group the data
61 / 112
summarize()
summarize(<DATA>, <NAME> = <FUNCTION>)62 / 112
summarize()
summarize(diamonds, n = n(), mean_price = mean(price))## # A tibble: 1 x 2## n mean_price## <int> <dbl>## 1 53940 3933.63 / 112
Your turn 7
Use summarise() to compute three statistics about the gapminder data set:
1. The first (min()) year in the data
2. The last (max()) year in the data
3. The total number of observations (n()) and the total number of unique countries in the data (n_distinct())
64 / 112
Your turn 7
gapminder %>% summarize( first = min(year), last = max(year), n = n(), n_countries = n_distinct(country) )## # A tibble: 1 x 4## first last n n_countries## <dbl> <dbl> <int> <int>## 1 1952 2007 1704 14265 / 112
group_by()
group_by(<DATA>, <VARIABLE>)66 / 112
group_by()
diamonds %>% group_by(cut)67 / 112
group_by()
diamonds %>% group_by(cut)## # A tibble: 53,940 x 10## # Groups: cut [5]## carat cut color clarity depth table price x y## <dbl> <ord> <ord> <ord> <dbl> <dbl> <int> <dbl> <dbl>## 1 0.23 Ideal E SI2 61.5 55 326 3.95 3.98## 2 0.21 Premium E SI1 59.8 61 326 3.89 3.84## 3 0.23 Good E VS1 56.9 65 327 4.05 4.07## 4 0.290 Premium I VS2 62.4 58 334 4.2 4.23## 5 0.31 Good J SI2 63.3 58 335 4.34 4.35## 6 0.24 Very G… J VVS2 62.8 57 336 3.94 3.96## 7 0.24 Very G… I VVS1 62.3 57 336 3.95 3.98## 8 0.26 Very G… H SI1 61.9 55 337 4.07 4.11## 9 0.22 Fair E VS2 65.1 61 337 3.87 3.78## 10 0.23 Very G… H VS1 59.4 61 338 4 4.05## # … with 53,930 more rows, and 1 more variable: z <dbl>68 / 112
group_by()
diamonds %>% group_by(cut) %>% summarize(n = n(), mean_price = mean(price))69 / 112
group_by()
diamonds %>% group_by(cut) %>% summarize(n = n(), mean_price = mean(price))## # A tibble: 5 x 3## cut n mean_price## <ord> <int> <dbl>## 1 Fair 1610 4359.## 2 Good 4906 3929.## 3 Very Good 12082 3982.## 4 Premium 13791 4584.## 5 Ideal 21551 3458.70 / 112
group_by()
diamonds %>% group_by(cut) %>% mutate(n = n(), mean_price = mean(price))71 / 112
group_by()
diamonds %>% group_by(cut) %>% mutate(n = n(), mean_price = mean(price))## # A tibble: 53,940 x 12## # Groups: cut [5]## carat cut color clarity depth table price x y## <dbl> <ord> <ord> <ord> <dbl> <dbl> <int> <dbl> <dbl>## 1 0.23 Ideal E SI2 61.5 55 326 3.95 3.98## 2 0.21 Premium E SI1 59.8 61 326 3.89 3.84## 3 0.23 Good E VS1 56.9 65 327 4.05 4.07## 4 0.290 Premium I VS2 62.4 58 334 4.2 4.23## 5 0.31 Good J SI2 63.3 58 335 4.34 4.35## 6 0.24 Very G… J VVS2 62.8 57 336 3.94 3.96## 7 0.24 Very G… I VVS1 62.3 57 336 3.95 3.98## 8 0.26 Very G… H SI1 61.9 55 337 4.07 4.11## 9 0.22 Fair E VS2 65.1 61 337 3.87 3.78## 10 0.23 Very G… H VS1 59.4 61 338 4 4.05## # … with 53,930 more rows, and 3 more variables: z <dbl>,## # n <int>, mean_price <dbl>72 / 112
Your turn 8
Extract the rows where continent == "Europe". Then use group_by() to group by country. Finally, use summarize() to compute:
1. The total number of observations for each country in Europe
2. The lowest observed life expectancy for each country
73 / 112
Your turn 8
gapminder %>% filter(continent == "Europe") %>% group_by(country) %>% summarize(n = n(), min_le = min(lifeExp))## # A tibble: 30 x 3## country n min_le## <fct> <int> <dbl>## 1 Albania 12 55.2## 2 Austria 12 66.8## 3 Belgium 12 68 ## 4 Bosnia and Herzegovina 12 53.8## 5 Bulgaria 12 59.6## 6 Croatia 12 61.2## 7 Czech Republic 12 66.9## 8 Denmark 12 70.8## 9 Finland 12 66.6## 10 France 12 67.4## # … with 20 more rows74 / 112
Your turn 9
Use grouping to calculate the mean life expectancy for each continent and year. Call the mean life expectancy variable mean_le. Plot the life expectancy over time (no need to change the plot code).
gapminder %>% __________ %>% __________ %>% ggplot(aes(x = year, y = mean_le, col = continent)) + geom_line() + scale_color_manual(values = continent_colors)75 / 112
Your turn 9
Use grouping to calculate the mean life expectancy for each continent and year. Call the mean life expectancy variable mean_le. Plot the life expectancy over time (no need to change the plot code).
gapminder %>% group_by(continent, year) %>% summarize(mean_le = mean(lifeExp)) %>% ggplot(aes(x = year, y = mean_le, col = continent)) + geom_line() + scale_color_manual(values = continent_colors)76 / 112
mutate_if/all/at()
summarize_if/all/at()
77 / 112
mutate_if/all/at()
summarize_if/all/at()
... etc!
77 / 112
Joining data
Use left_join(), right_join(), full_join(), or inner_join() to join datasets
Use semi_join() or anti_join() to filter datasets against each other
78 / 112
Resources
R for Data Science: A comprehensive but friendly introduction to the tidyverse. Free online.
RStudio Primers: Free interactive courses in the Tidyverse
10 dplyr tips: a Twitter thread on other useful aspects of dplyr
79 / 112

Game plan:
Bonus: joining data and dplyr with databases
81 / 112
superheroes## # A tibble: 7 x 4## name alignment gender publisher ## <chr> <chr> <chr> <chr> ## 1 Magneto bad male Marvel ## 2 Storm good female Marvel ## 3 Mystique bad female Marvel ## 4 Batman good male DC ## 5 Joker bad male DC ## 6 Catwoman bad female DC ## 7 Hellboy good male Dark Horse Comicspublishers## # A tibble: 3 x 2## publisher yr_founded## <chr> <int>## 1 DC 1934## 2 Marvel 1939## 3 Image 199282 / 112
Joining data
superheroes %>% left_join(publishers, by = "publisher")## # A tibble: 7 x 5## name alignment gender publisher yr_founded## <chr> <chr> <chr> <chr> <int>## 1 Magneto bad male Marvel 1939## 2 Storm good female Marvel 1939## 3 Mystique bad female Marvel 1939## 4 Batman good male DC 1934## 5 Joker bad male DC 1934## 6 Catwoman bad female DC 1934## 7 Hellboy good male Dark Horse Comics NA83 / 112
Joining data
publishers %>% left_join(superheroes, by = "publisher")## # A tibble: 7 x 5## publisher yr_founded name alignment gender## <chr> <int> <chr> <chr> <chr> ## 1 DC 1934 Batman good male ## 2 DC 1934 Joker bad male ## 3 DC 1934 Catwoman bad female## 4 Marvel 1939 Magneto bad male ## 5 Marvel 1939 Storm good female## 6 Marvel 1939 Mystique bad female## 7 Image 1992 <NA> <NA> <NA>84 / 112
85 / 112

86 / 112
87 / 112

88 / 112

89 / 112

90 / 112
SQL with dplyr
# install.packages("RSQLite")library(dbplyr)library(DBI)con <- DBI::dbConnect(RSQLite::SQLite(), path = ":dbname:")copy_to(con, gapminder, "gapminder")gapminder_tbl <- tbl(con, "gapminder")91 / 112
gapminder_tbl## # Source: table<gapminder> [?? x 6]## # Database: sqlite 3.22.0 []## country continent year lifeExp pop gdpPercap## <chr> <chr> <int> <dbl> <int> <dbl>## 1 Afghanistan Asia 1952 28.8 8425333 779.## 2 Afghanistan Asia 1957 30.3 9240934 821.## 3 Afghanistan Asia 1962 32.0 10267083 853.## 4 Afghanistan Asia 1967 34.0 11537966 836.## 5 Afghanistan Asia 1972 36.1 13079460 740.## 6 Afghanistan Asia 1977 38.4 14880372 786.## 7 Afghanistan Asia 1982 39.9 12881816 978.## 8 Afghanistan Asia 1987 40.8 13867957 852.## 9 Afghanistan Asia 1992 41.7 16317921 649.## 10 Afghanistan Asia 1997 41.8 22227415 635.## # … with more rows92 / 112
dplyr works out-of-box with numerous types of databases
gapminder_tbl %>% summarize( first = min(year, na.rm = TRUE), last = max(year, na.rm = TRUE), n = n(), n_countries = n_distinct(country) )## # Source: lazy query [?? x 4]## # Database: sqlite 3.22.0 []## first last n n_countries## <int> <int> <int> <int>## 1 1952 2007 1704 14293 / 112
dplyr works out-of-box with numerous types of databases
gapminder_tbl %>% summarize( first = min(year, na.rm = TRUE), last = max(year, na.rm = TRUE), n = n(), n_countries = n_distinct(country) ) %>% show_query()94 / 112
dplyr works out-of-box with numerous types of databases
gapminder_tbl %>% summarize( first = min(year, na.rm = TRUE), last = max(year, na.rm = TRUE), n = n(), n_countries = n_distinct(country) ) %>% show_query()SELECT MIN(`year` ) AS `first` , MAX(`year` ) AS `last` , COUNT() AS `n` , COUNT(DISTINCT `country` ) AS `n_countries`
FROM `gapminder` `
94 / 112
use collect() to pull to local data frame
local_df <- gapminder_tbl %>% summarize( first = min(year, na.rm = TRUE), last = max(year, na.rm = TRUE), n = n(), n_countries = n_distinct(country) ) %>% collect()local_df## # A tibble: 1 x 4## first last n n_countries## <int> <int> <int> <int>## 1 1952 2007 1704 14295 / 112
Disconnect
dbDisconnect(con)96 / 112
Game plan:
Bonus: joining data and dplyr with databases
Bonus: tidying data: tidyr
97 / 112
tidyr
Functions for tidying data.
What is tidy data?
“Tidy datasets are all alike, but every messy dataset is messy in its own way.” –– Hadley Wickham
98 / 112
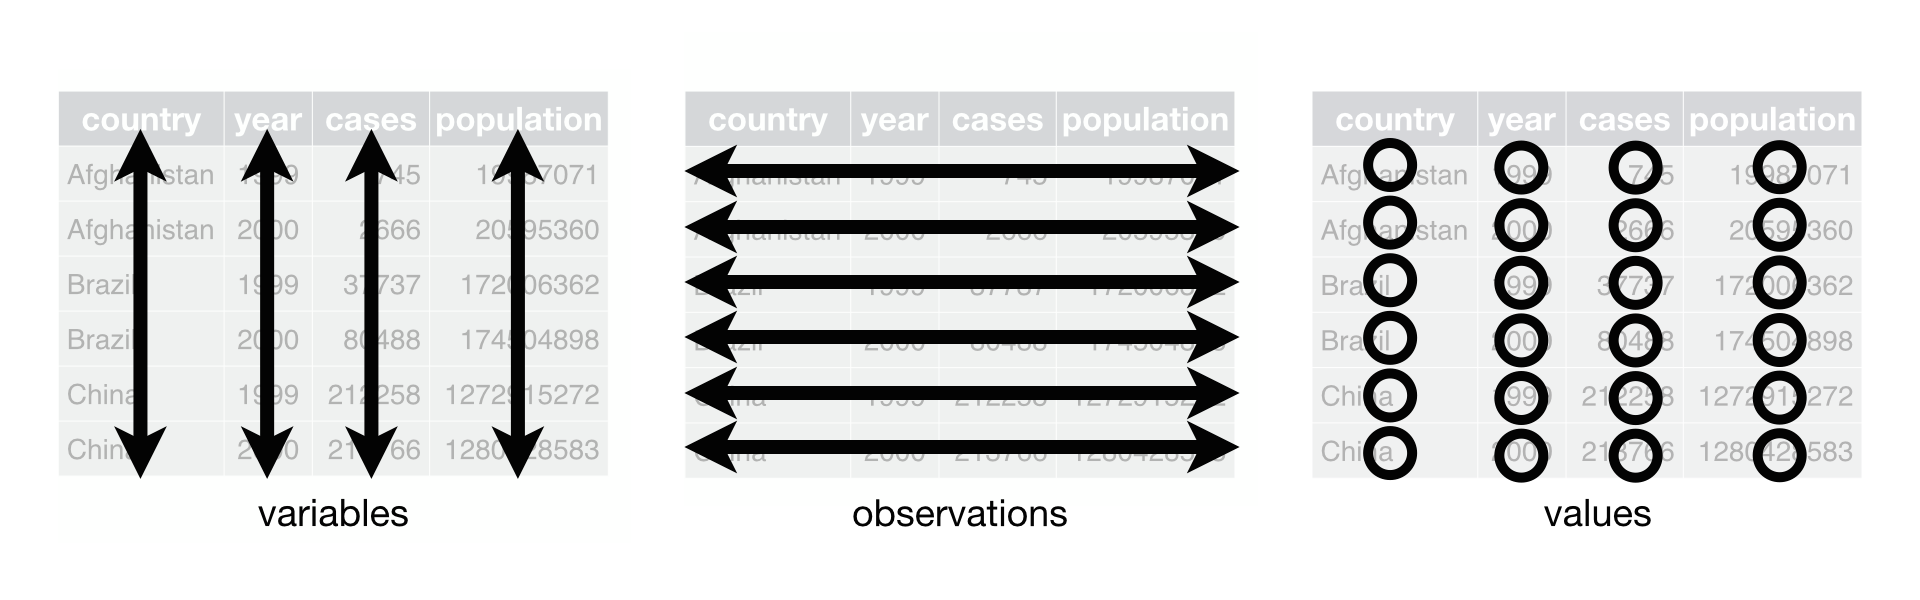
Tidy Data
99 / 112
Tidy Data
Each column is a single variable
100 / 112
Tidy Data
Each column is a single variable
Each row is a single observation
101 / 112
Tidy Data
Each column is a single variable
Each row is a single observation
Each cell is a value
102 / 112
gather()
gather(<DATA>, "<KEY>", "<VALUE>", <VARIABLES>)103 / 112
gather()
lotr## # A tibble: 9 x 4## film race female male## <chr> <chr> <int> <int>## 1 The Fellowship Of The Ring Elf 1229 971## 2 The Fellowship Of The Ring Hobbit 14 3644## 3 The Fellowship Of The Ring Man 0 1995## 4 The Two Towers Elf 331 513## 5 The Two Towers Hobbit 0 2463## 6 The Two Towers Man 401 3589## 7 The Return Of The King Elf 183 510## 8 The Return Of The King Hobbit 2 2673## 9 The Return Of The King Man 268 2459104 / 112
lotr %>% gather("sex", "words", female:male)## # A tibble: 18 x 4## film race sex words## <chr> <chr> <chr> <int>## 1 The Fellowship Of The Ring Elf female 1229## 2 The Fellowship Of The Ring Hobbit female 14## 3 The Fellowship Of The Ring Man female 0## 4 The Two Towers Elf female 331## 5 The Two Towers Hobbit female 0## 6 The Two Towers Man female 401## 7 The Return Of The King Elf female 183## 8 The Return Of The King Hobbit female 2## 9 The Return Of The King Man female 268## 10 The Fellowship Of The Ring Elf male 971## 11 The Fellowship Of The Ring Hobbit male 3644## 12 The Fellowship Of The Ring Man male 1995## 13 The Two Towers Elf male 513## 14 The Two Towers Hobbit male 2463## 15 The Two Towers Man male 3589## 16 The Return Of The King Elf male 510## 17 The Return Of The King Hobbit male 2673## 18 The Return Of The King Man male 2459105 / 112
table4a %>% gather("year", "cases", -country)## # A tibble: 6 x 3## country year cases## <chr> <chr> <int>## 1 Afghanistan 1999 745## 2 Brazil 1999 37737## 3 China 1999 212258## 4 Afghanistan 2000 2666## 5 Brazil 2000 80488## 6 China 2000 213766106 / 112
spread()
spread(<DATA>, <KEY>, <VALUE>)107 / 112
spread()
lotr %>% gather("sex", "words", female:male) %>% spread(race, words)## # A tibble: 6 x 5## film sex Elf Hobbit Man## <chr> <chr> <int> <int> <int>## 1 The Fellowship Of The Ring female 1229 14 0## 2 The Fellowship Of The Ring male 971 3644 1995## 3 The Return Of The King female 183 2 268## 4 The Return Of The King male 510 2673 2459## 5 The Two Towers female 331 0 401## 6 The Two Towers male 513 2463 3589108 / 112
table2 %>% spread(type, count) %>% mutate(prevalence = (cases/population) * 100000)## # A tibble: 6 x 5## country year cases population prevalence## <chr> <int> <int> <int> <dbl>## 1 Afghanistan 1999 745 19987071 3.73## 2 Afghanistan 2000 2666 20595360 12.9 ## 3 Brazil 1999 37737 172006362 21.9 ## 4 Brazil 2000 80488 174504898 46.1 ## 5 China 1999 212258 1272915272 16.7 ## 6 China 2000 213766 1280428583 16.7109 / 112
who %>% gather("codes", "n", 5:60) %>% select(country, year, codes, n)## # A tibble: 405,440 x 4## country year codes n## <chr> <int> <chr> <int>## 1 Afghanistan 1980 new_sp_m014 NA## 2 Afghanistan 1981 new_sp_m014 NA## 3 Afghanistan 1982 new_sp_m014 NA## 4 Afghanistan 1983 new_sp_m014 NA## 5 Afghanistan 1984 new_sp_m014 NA## 6 Afghanistan 1985 new_sp_m014 NA## 7 Afghanistan 1986 new_sp_m014 NA## 8 Afghanistan 1987 new_sp_m014 NA## 9 Afghanistan 1988 new_sp_m014 NA## 10 Afghanistan 1989 new_sp_m014 NA## # … with 405,430 more rows110 / 112
separate()/unite()
separate(<DATA>, <VARIABLE>, into = c("<VARIABLE1>", "<VARIABLE2>"))unite(<DATA>, <VARIABLES>)111 / 112
cases <- tribble( ~id, ~sex_age, "1", "male_56", "2", "female_77", "3", "female_49")separate(cases, sex_age, into = c("sex", "age"), convert = TRUE)## # A tibble: 3 x 3## id sex age## <chr> <chr> <int>## 1 1 male 56## 2 2 female 77## 3 3 female 49112 / 112